Design dell’interfaccia utente grafica (GUI)
Abbiamo avviato il progetto Atlante della Svizzera (AdS) con un concetto completo, in cui la GUI rappresenta un elemento essenziale del nostro atlante interattivo. Perciò il design della GUI è stato inserito sin dall’inizio nel processo di pianificazione e realizzazione. Per poter applicare correttamente la struttura piuttosto complessa dell’Atlante, si è seguito l’approccio dell’Interaction Design (IxD). Sostanzialmente, questo approccio IxD si può suddividere in quattro fasi principali: 1) Investigation, 2) Design di base, 3) Design dettagliato e 4) Implementazione . Le prime tre fasi, realizzate in collaborazione con la società dreipol GmbH incaricata dell’IxD sono già state ultimate e al momento lavoriamo all’implementazione degli elementi GUI e al loro collegamento con l’APSglobe.
Investigation
Per la fase investigativa abbiamo dapprima studiato la GUI attuale, per avere una panoramica e farci delle idee sui possibili layout GUI. Successivamente è stata definita la struttura generale GUI con l’aiuto di tecniche UCD.
All’inizio sono stati eseguiti degli studi sullo stato dell’arte di atlanti web, geoportali e mappamondi virtuali. Al fine di ottenere esperienze con le GUI per gli apparecchi mobili, gli studenti della Zürcher Hochschule der Künste hanno realizzato dei prototipi servendosi di materiale tratto dall’AdS3. Un ulteriore studio, eseguito per applicazioni Desktop con “Digital Natives”, ha fornito utili indicazioni relative al layout ottimale della GUI e ci ha consentito di acquisire maggiori nozioni sul comportamento del gruppo target dei giovani utenti.
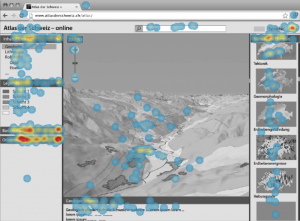
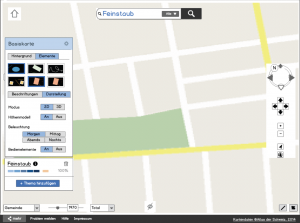
Studio utenti con GUI per Desktop per atlanti: gli studenti hanno ricevuto l’incarico di cercare informazioni supplementari sul tema delle carte. Le relative carte di densità dei clic mostrano, a seconda del layout della GUI, modelli concentrati (sinistra) o diffusi (destra) per lo stesso compito. (Schnürer et al. 2015)
La valutazione dei requisiti generali ci ha indotti a optare per il design di riferimento per Windows 8 Metro con design responsivo; successivamente si è creato un mockup per verificarne la fattibilità.
In seguito abbiamo formulato diversi casi d’uso per l’utilizzo dell’Atlante, in cui si descrivono situazioni tipiche con cosiddette persone (studenti, giornalisti, anziani, escursionisti, ecc.), scenari (formazione, lavoro, tempo libero) e attività (es. confronto dei layer cartografici, aggiunta di dati propri, adeguamento della carta).
Infine è stata definita una lista di funzioni interattive dell’Atlante essenziali e avanzate. Poiché la nuova edizione dell’AdS si concentrerà sulla visualizzazione e sull’esplorazione di carte in 3D, inizialmente si è introdotto un numero limitato di funzioni, quali ad esempio la ricerca di luoghi e temi, la selezione del tempo, la richiesta di informazioni sulle carte, la misurazione di distanze e superfici e la visualizzazione di elementi multimediali.
Design di base
La fase del design di base è decisiva per l’intero progetto dell’Atlante. In questa fase si definisce il “Look and Feel” dell’Atlante. Molto probabilmente gli utenti resteranno collegati all’Atlante più a lungo se il design complessivo della GUI risulta attraente!
I grafic designer IxD hanno creato numerose versioni di GUI per mezzo di wireframes e moodboards comprensive di schemi di scritte e colori, che abbiamo poi potuto valutare.
Wireframe (links) and Moodboard (destra) della pagina di avvio dell’Atlante della Svizzera in 3D.
Wireframe (links) and Moodboard (rechts) della pagina delle carte dell’Atlante della Svizzera in 3D.
L’orientamento di base del design della GUI è stato poi impiegato su entrambe le pagine principali dell’Atlante, la pagina iniziale e la pagina delle carte. Le decisioni riguardo al layout generale, al design responsivo, alla tipografia, ai colori della legenda, ecc. sono state messe per iscritto. Gli esiti di questa fase sono stati mostrati nella Design Direction Presentation (DDP), essenziale per prendere le ulteriori decisioni riguardo all’aspetto grafico e agli elementi della GUI.
Design dettagliato
L’obiettivo della fase del design dettagliato consiste nell’ottenere un layout grafico corretto per la GUI dell’Atlante e interazioni prestabilite per la fase di implementazione.
Per il design dettagliato è stato necessario disegnare tutte le varianti del layout della GUI e tutti i singoli elementi in formato vettoriale. Sono state così create delle pagine di layout, come le carte della settimana, la selezione della categoria tematica, la funzione di ricerca, la guida e l’impressum. Sono state quindi inserite sequenze animate per illustrare il passaggio dalla pagina iniziale alla pagina delle carte e viceversa. Al fine di risparmiare tempo e costi, il design dettagliato delle icone vettoriali è stato eseguito sulla base di una biblioteca già esistente. Infine, alle descrizioni delle modalità (on/off) e delle funzioni interattive (es. tool per misurare le distanze) sono state aggiunte anche immagini, in quanto una mera descrizione sarebbe facilmente equivocabile per chi sviluppa i software.
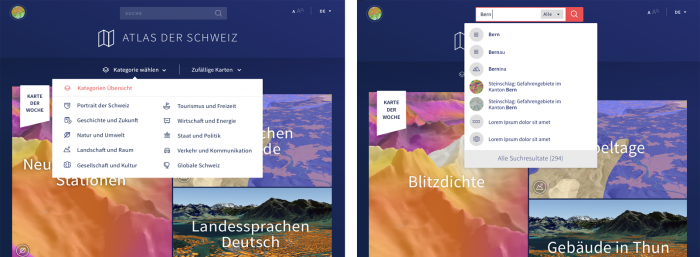
Design dettagliato della pagina iniziale con le categorie principali (sinistra) e la ricerca rapida (destra) dell’AdS – online.
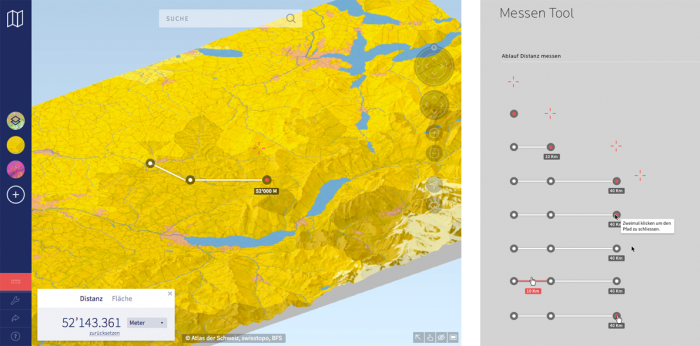
Design dettagliato della pagina delle carte (sinistra) e specifiche del tool di misurazione delle distanze (destra) per l’AdS – online.
L’esito di questa fase è la Detailed Design Documentation (DDD), che serve come documento di riferimento e contiene la specifica (dimensioni, comportamenti) di ciascun elemento della GUI.
Implementazione
Uno dei principali obiettivi della implementazione della GUI consiste nel contenere al massimo l’impiego di risorse, per non impedire i complessi processi di visualizzazione. Perciò abbiamo redatto un elenco delle tecnologie applicabili. La Chromium Embedded Framework (CEF)1 che serve da browser è stata selezionata come JavaScript-Frameworkvue.js. Per garantire una corretta comunicazione con il back end dell’Atlante e il motore di visualizzazione 3D, sono stati definiti modelli di dati ed eventi di interfaccia. Riguardo al linguaggio CSS i nostri sviluppatori IxD del front end hanno avuto libera scelta e hanno optato per SASS. Come code repository è stato utilizzato Github, per documentare e verificare regolarmente i progressi dell’implementazione.
Il passo successivo è consistito nella realizzazione dei moduli per la ditta incaricata dell’IxD, comprendenti strutture e moduli di base (layout delle singole pagine, sistema di icone, menù standard a tendina e pulsanti, ecc.), moduli di contenuto (risultati della ricerca, informazioni multimediali, overlay, ecc.), moduli GUI (icone, menù a tendina, pulsanti), animazioni (cambio di pagina, effetti hover su icone, ecc.) e interfaccia per i componenti della GUI. Dopo la consegna di ogni modulo è stato eseguito un test di implementazione per migliorare l’applicazione con metodi iterativi. Al termine di questa quarta e ultima fase è stato programmato un test di usabilità con diversi gruppi di utenti attuali dell’AdS3 e persone che non conoscono l’AdS.
In conclusione dell’intero processo di design della GUI si avrà la disponibilità di una GUI operativa, robusta e capace di operare con rapidità anche in condizioni difficili. L’obiettivo è far sì che la GUI supporti gli utenti durante l’esplorazione dei temi delle carte, senza risultare invadente.