Altersverteilung der Bevölkerung in Europa
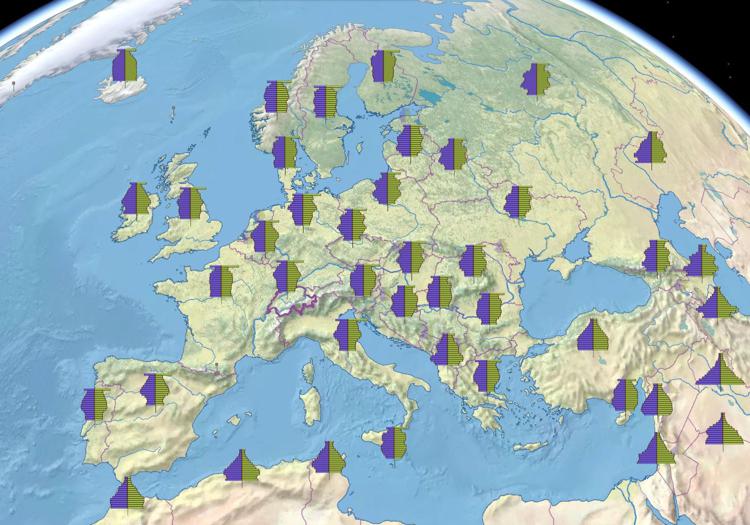
Die Bevölkerung der EU ist in den letzten Jahren gealtert. Die unter Fünfzehnjährigen machten im Jahr 2014 15,6% der Bevölkerung der EU aus, wobei ihr Anteil von einem Mitgliedstaat zum anderen jedoch beträchtlich schwankte: Die Spanne reichte von 13,1% in Deutschland bis zu 22,0% in Irland. Dagegen stieg der Anteil der über 64-jährigen an der Bevölkerung der EU auf 18,6% im Jahr 2014 und lag in
Altersstruktur
Stichwörter: Globale Schweiz, Gesellschaft und Kultur, Demografie, Demografie
Räumliche Ausdehnung: Europa
Zeiten: 1960, 1970, 1980, 1990, 2000, 2010, 2015, 2020
Unterscheidung: 10-Jahres-Klasse, 5-Jahres-Klasse
Kartenobjekte: Ägypten, Albanien, Algerien, Andorra, Armenien, Aserbaidschan, Belgien, Bosnien und Herzegowina, Bulgarien, Dänemark, Deutschland, Estland, Finnland, Frankreich, Georgien, Griechenland, Irak, Iran, Irland, Island, Israel, Italien, Jordanien, Kasachstan, Kosovo, Kroatien, Lettland, Libanon, Liechtenstein, Litauen, Luxemburg, Malta, Marokko, Monaco, Montenegro, Niederlande, Nordmazedonien, Nordmazedonien, Norwegen, Österreich, Palästinensische Gebiete, Polen, Portugal, Republik Moldau, Rumänien, Russland, San Marino, Saudi-Arabien, Schweden, Schweiz, Serbien, Slowakei, Slowenien, Spanien, Syrien, Tschechien, Tschechien, Tunesien, Türkei, Ukraine, Ungarn, Vereinigtes Königreich, Weissrussland, Zypern